
![]()
Precise Averages
If you’ve ever made a photocopy of a photocopy, you know that it never comes out quite as clear as a photocopy of an original. The sharp edges become a bit duller. The same is true when we take the average of averages. It’s not as accurate as taking an overall average of the original data that the averages came from.
This is a question that comes up often when we are looking at the Grand Total row of a pivot table.
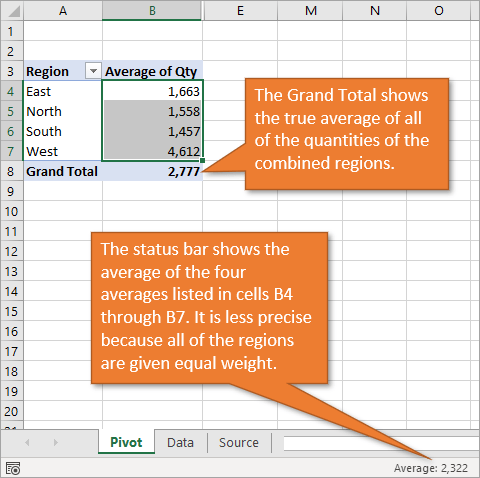
The example above shows a pivot table with a summary report of Average Qty by Region. If you select all of the cells in the Values area (for each region), you’ll notice that the Average calculation in the status bar is different from the result in the Grand Total row of the pivot table.
Why is this?
Understanding Pivot Table Calculations
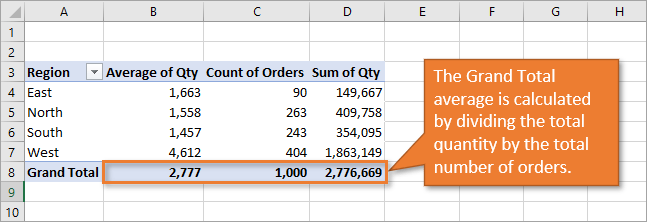
The Grand Total average in the pivot table is adding up all of the cells in the quantity column of the data set and dividing it by the total number of orders.
The status bar average, however, doesn’t take into account that the West Region had four times the number of orders as the East Region. Instead, it gives them equal weight when it averages the four regions’ averages together, skewing the number down.
It’s important to understand that each cell in the values area of the pivot table is doing a calculation on the source data. This includes the subtotal and grand total rows or columns.
The calculation is based on the filter context for each cell. In this example, the Grand Total row is calculating the Average of all of the cells in the Qty column of the source range. It is NOT actually taking the average of the cells in the Values area of the pivot table.
Totals for Other Calculation Types
Another way to look at this is with the Count calculation type. If the pivot table did the calculation based on the cells in the values area, the Total Count of Qty in cell C8 would be 4 because there are 4 numbers in the cells above.
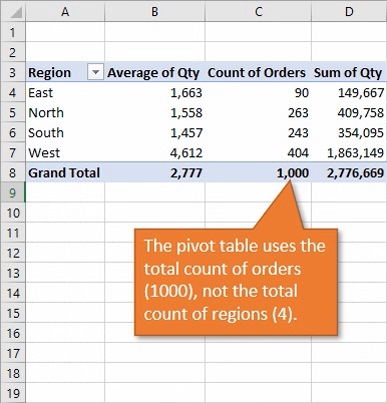
Of course this would be incorrect. Instead, the pivot table does the Count calculation on the source data range based on the current filter context applied to the pivot table. If the pivot table has a filter applied (in the filters area or with a slicer), then the result in the Grand Total Row or Column will reflect that.
Tying out the Numbers
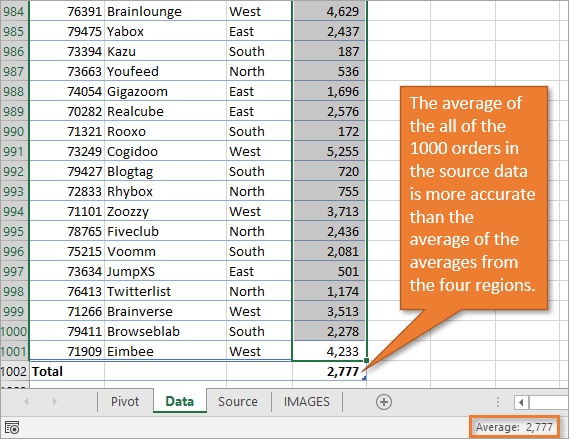
One easy way to see this is to use a Table for the source data range of your pivot table, and then tie out the numbers with the Total Row.
You can turn on the Total Row by selecting any cell in the Table, going to the Design tab on the Ribbon and selecting the Total Row checkbox.
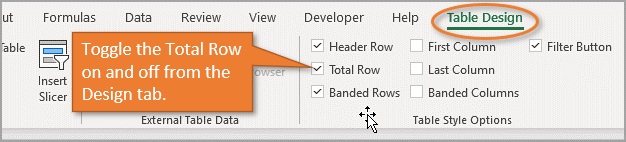
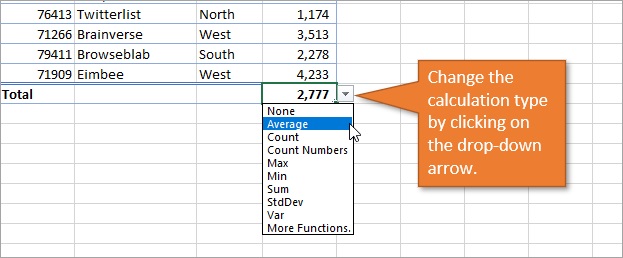
By default, the total row will show the sum of all the cells using the SUBTOTAL function. I explain that more in this post: The SUBTOTAL Function for Excel Tables Total Row Explained. But you can change the calculation to an average by choosing Average from the drop-down menu accessed by clicking on the small down arrow.
You can then filter the source data range for the same filters that are applied to the pivot table. The calculations in the Total Row of the table should match the results of the Grand Total Row/Column of the pivot table.
How useful was this post?
- Share review with rating here: Google Review
We are providing practical training (Labor Laws, Payroll, Salary Structure, PF-ESI Challan) and Labor Codes, Payroll Consultant Service & more:
- HR Generalist Practical Training + Certificate: https://oneclik.in/hr-generalist-practical-training/
- Labor Law + Payroll Practical Training + Certificate : https://oneclik.in/labor-law-payroll-practical-training-certificate/ (PF, ESI, Bonus, Payroll & more)
- HR Analytics Practical Training + Certificate: https://oneclik.in/hr-analytics-practical-training-certificate/
- Labor Code, 2020 (Crash Course) + Certificate: https://oneclik.in/labor-code2020-rules-practical-training-certificate-crash-course/
- Advance Excel Practical Training + Certificate: https://oneclik.in/advanced-excel-practical-training-certificate/
- Disciplinary Proceeding & Domestic Enquiry – Practical Training + Certificate: https://oneclik.in/disciplinary-proceeding-domestic-enquiry-short-term-course-with-latest-updates/
- PoSH Act, 2013 (Sexual Harassment Of Women At Workplace & Vishaka Guidelines) – Practical Training + Certificate: https://oneclik.in/sexual-harassment-of-women-at-workplace-vishaka-guidelines-short-term-course-with-latest-amendments/
- Compensation & Benefits – Practical Training + Certificate: https://oneclik.in/compensation-benefits-practical-training-certificate/
- Industrial Relations – Practical Training + Certificate: https://oneclik.in/industrial-relations-practical-training-certificate/
- Labour Code (2019 & 2020) With Latest Updates | Labour Bill (Labour-Law-Practical-Training): https://oneclik.in/labour-law-practical-training/ (Factory, Contact Labor, Maternity Act & more)
- PF – ESI Consultant Service: https://oneclik.in/pf-esi-consultant-service/
- Labor Law, Compliance & HR – Payroll Management
Get Latest HR, IR, Labor Law Updates, Case Studies & Regular Updates: (Join us on Social Media)
- Telegram Channel: “One Clik”
- Whatsapp Group: https://wa.me/919033016939
- Facebook: One Clik
- Linkedin: One Clik
- Instagram: oneclik_hr_management
- YouTube: One Clik
Disclaimer: All the information on this website/blog/post is published in good faith, fair use & for general informational purposes only and is not intended to constitute legal advice.